
All topics
Probability Explained Visually
Probability goes wrong when it stays abstract. Count the outcomes, draw the overlap, shade the area under the curve, and most paradoxes stop being paradoxes.
Each video turns a rule into something you can count or measure on screen.
Probability videos made with eduvids
 Video
VideoProbability
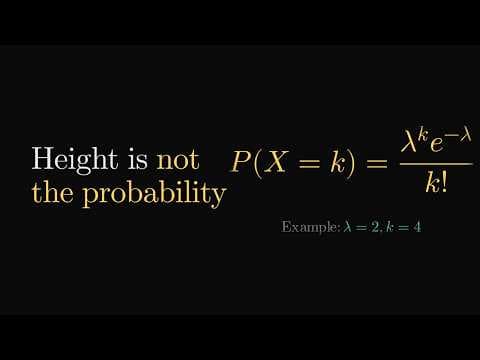
Why the Area Under a Curve Equals 1
Why every probability density curve encloses an area of exactly 1, and how area under the curve becomes probability for a continuous random variable.
 Video
VideoProbability
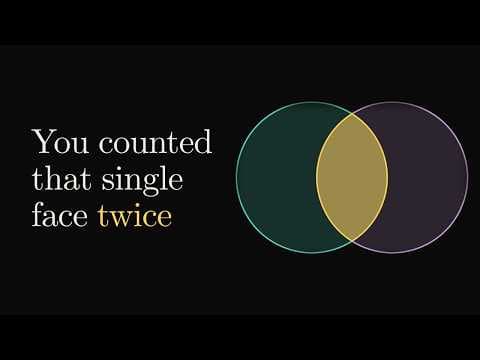
Why Overlapping Events Break Naive Addition
Why P(A or B) is not simply P(A) + P(B) when events overlap, and how the inclusion–exclusion principle removes the outcomes counted twice.
Make your own probability video
Free, no account needed. Pick an idea or write your own.